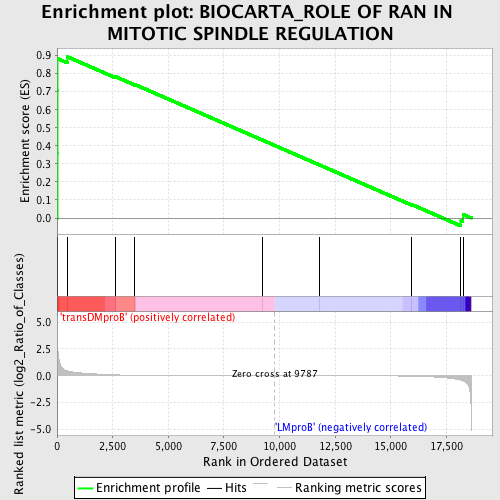
Profile of the Running ES Score & Positions of GeneSet Members on the Rank Ordered List
| Dataset | Set_04_transDMproB_versus_LMproB.phenotype_transDMproB_versus_LMproB.cls #transDMproB_versus_LMproB |
| Phenotype | phenotype_transDMproB_versus_LMproB.cls#transDMproB_versus_LMproB |
| Upregulated in class | transDMproB |
| GeneSet | BIOCARTA_ROLE OF RAN IN MITOTIC SPINDLE REGULATION |
| Enrichment Score (ES) | 0.8929735 |
| Normalized Enrichment Score (NES) | 1.4354366 |
| Nominal p-value | 0.028142588 |
| FDR q-value | 0.8322613 |
| FWER p-Value | 1.0 |
| PROBE | DESCRIPTION (from dataset) | GENE SYMBOL | GENE_TITLE | RANK IN GENE LIST | RANK METRIC SCORE | RUNNING ES | CORE ENRICHMENT | |
|---|---|---|---|---|---|---|---|---|
| 1 | RANBP1 | 9692 5357 | 3 | 4.557 | 0.3579 | Yes | ||
| 2 | RAN | 5356 9691 | 6 | 4.449 | 0.7073 | Yes | ||
| 3 | RANGAP1 | 2180 22195 | 37 | 2.246 | 0.8821 | Yes | ||
| 4 | KPNA2 | 9245 | 468 | 0.432 | 0.8930 | Yes | ||
| 5 | RCC1 | 15735 | 2642 | 0.079 | 0.7824 | No | ||
| 6 | AURKA | 14325 | 3497 | 0.039 | 0.7396 | No | ||
| 7 | KIF15 | 9955 5563 19257 | 9213 | 0.001 | 0.4325 | No | ||
| 8 | KPNB1 | 20274 | 11790 | -0.004 | 0.2944 | No | ||
| 9 | RANBP2 | 20019 | 15939 | -0.043 | 0.0748 | No | ||
| 10 | TPX2 | 14790 | 18152 | -0.407 | -0.0121 | No | ||
| 11 | NUMA1 | 18167 | 18244 | -0.471 | 0.0200 | No |

